Learning Commons Knowledge Graph connects state academic standards, learning components, progressions, crosswalks, and curriculum across all 50 states. It gives builders one queryable source for standards data.
One of the most common problems teams run into is standards alignment: content needs to be aligned to state academic standards, but state academic standards were never built to be interoperable. Fifty different state frameworks, each with its own numbering scheme and update cycle, no canonical identifier for a skill, and no reliable way to know whether a standard in Texas is teaching the same thing as one in Oregon.
Most teams solve this by building a standards database internally, licensing a flat dataset, or asking an LLM to do the alignment work. But each has real limitations. Internal databases drift out of date and only cover the states you’ve already added. Licensed datasets give you text to look up but not structure to query. And LLMs will produce confident, plausible-sounding academic standard references with no ground-truth layer to catch the errors before they reach a teacher’s dashboard.
What is a knowledge graph, and why does structure matter
A flat database can show you the text of an academic standard and some connections within a dataset. But a knowledge graph is optimized to do something different: show connections across a wide collection of datasets and expand on those connections as new data is added.
Most state academic standards databases are essentially spreadsheets: rows of standards with columns for state, grade, subject, and text. You can look up an academic standard. You can filter by grade level. But you cannot ask the richer, more instructionally useful questions that experienced teachers know how to answer.
- Which skills does this standard depend on?
- Which other standards are related to this one?
- What is the instructional path from where this student is to where they need to be?
A spreadsheet sees the world as simple rows and columns. A knowledge graph sees it as connections or relationships— the way people actually think about knowledge. Academic standards, skills, and curriculum materials are all data. But this academic standard depends on that other one, this skill is shared by standards in two different states, this lesson addresses these three standards.
This structure is what makes Learning Commons Knowledge Graph different from a standards database. When you pull an academic standard from Knowledge Graph, you are not just getting the text. You are getting its prerequisites, its component skills, its crosswalk mappings, and its place in the learning progression.
What is in Learning Commons Knowledge Graph
Knowledge Graph contains five types of interconnected educational data. Each is useful on its own, but the value compounds as you leverage the way Knowledge Graph connects them.
Data type 1: State Academic Standards
Academic standards are the official learning expectations set by states — things like “Understand a fraction 1/b as the quantity formed by 1 part when a whole is partitioned into b equal parts” (Common Core 3.NF.A.1). They define what students must know and be able to do at each grade level.
Data type 2: Learning Components
Learning components are granular representations of the individual skills and concepts that make up a standard. While academic standards often define learning goals at a high level, learning components operate at the level where instruction actually happens: during a lesson, an activity, or a single question.
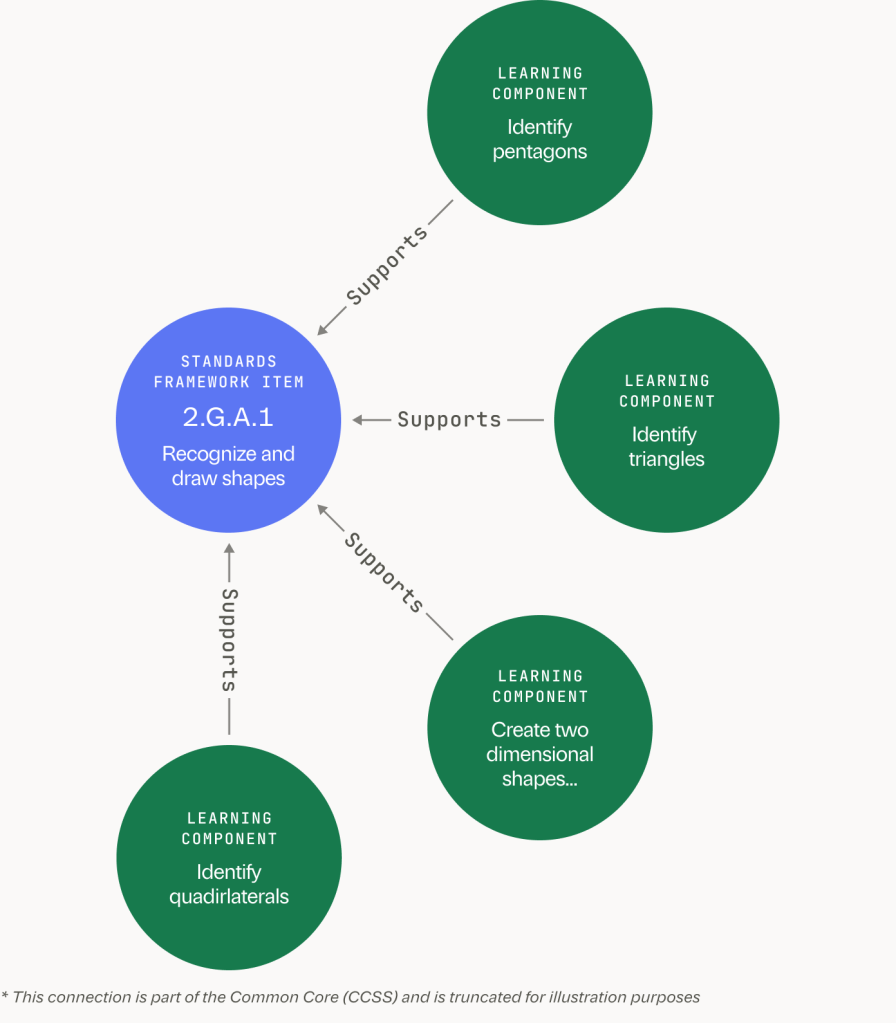
A standard like 2.G.A.1 (recognize and draw shapes based on their defining attributes) is supported by several distinct learning components, including “identify triangles,” “identify quadrilaterals,” and “identify pentagons.” Breaking a standard down to this level makes it possible to pinpoint exactly where a student is in their learning, not just which standard they’re working toward. Learning components are sourced from Achievement Network.
Data type 3: Learning Progressions
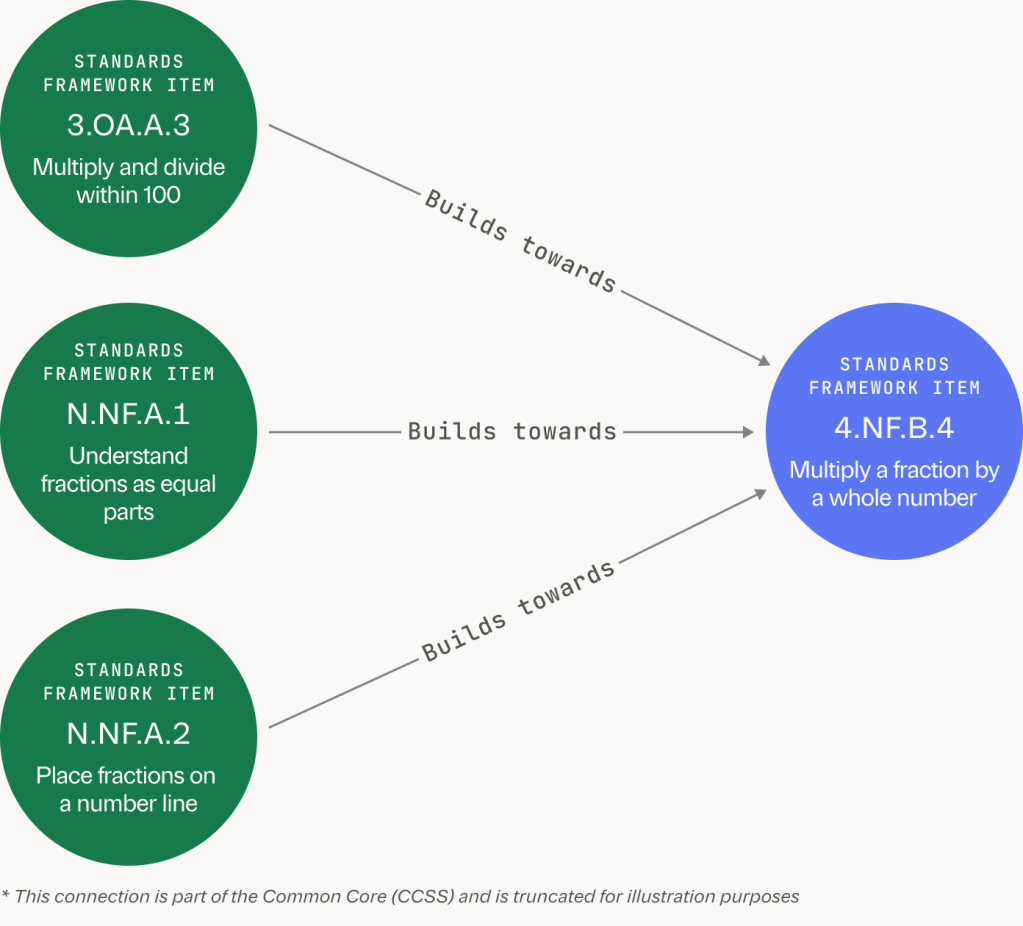
Learning progressions describe the research-supported order in which standards depend on one another. Multiplying fractions by a whole number (4.NF.B.4) builds on multiplying whole numbers (3.OA.A.3) and understanding fractions (3.NF.A.1 and 3.NF.A.2). Progressions encode these dependencies — which standards are prerequisites for others and which ones a given standard builds toward — based on research from Student Achievement Partners.
Data type 4: Math Standards Crosswalks
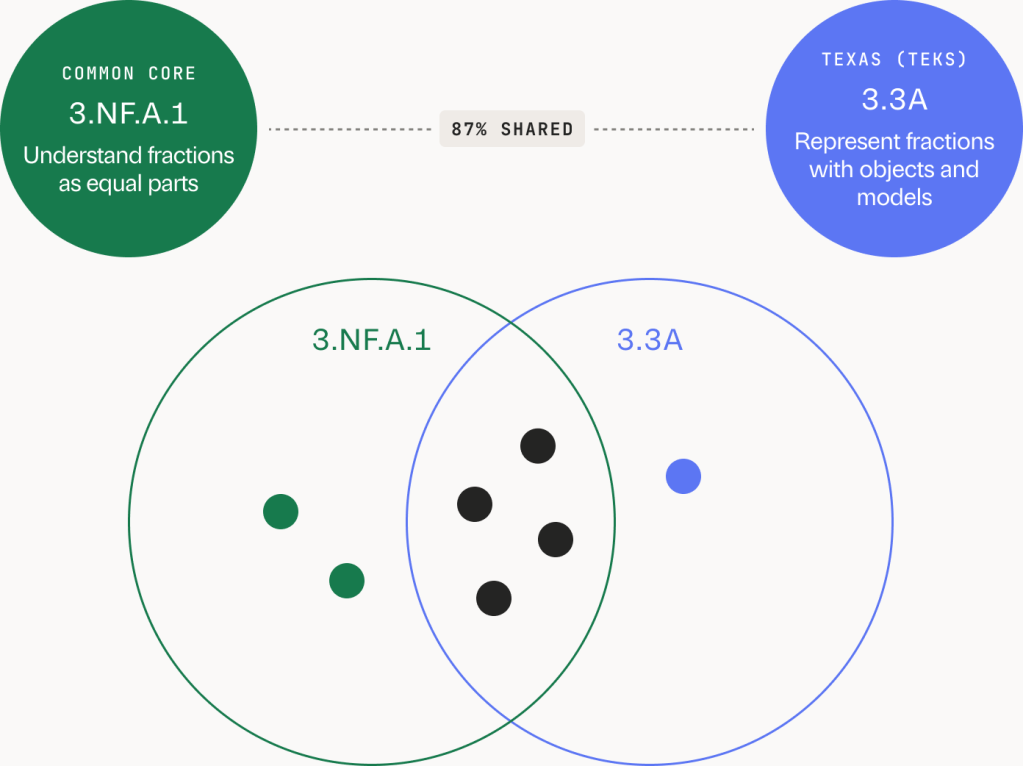
Math standards crosswalks connect Common Core standards to the equivalent standards in each state, based on their similarity. Because states use different codes and language for standards that often teach the same skills, crosswalks tell you how closely related two standards actually are. Our crosswalks do this not based on how similar the text looks, but based on the underlying math concepts and skills — what we call ‘learning components’ — that they have in common. Texas standard 3.3A and Common Core 3.NF.A.1 share 87% of the same learning components.
Data type 5: Curriculum
Curriculum is the actual instructional material students learn from — the courses, units, lessons, and activities that teachers use in the classroom. Every curriculum item in Knowledge Graph is linked to the academic standards it teaches, so you can move in either direction: from a standard to the lessons that address it, or from a lesson to all the standards it covers. Current curriculum partners include Illustrative Mathematics, with additional publishers being added over time.
How Learning Commons Knowledge Graph can help
Any one of these data types is useful on its own. But the graph connects them all — a single query can start with an academic standard, follow its prerequisites, find equivalent standards in another state via shared learning components, and surface the curriculum materials that teach it.
Here is where teams most often find it useful.
Replacing fragmented standards infrastructure. Most edtech teams maintain a fragmented set of standards data that drifts out of date and rarely covers every state. Knowledge Graph gives you a single source of truth across all 50 states, so your team stops carrying that maintenance burden internally and engineers stop managing alignment updates manually each year.
Aligning content at the skill level, not just the standard level. Academic standards on their own are often too broad for AI-driven products and adaptive experiences. Learning components break each standard down to the level where instruction actually happens, which makes them the right unit for student knowledge models, gap diagnosis, and feedback that is specific enough to be actionable.
Grounding AI outputs in real educational context. Models without a ground-truth layer produce plausible-sounding standard references that do not always exist. Connecting your model to Knowledge Graph gives it a structured source for academic standards, learning components, and curriculum materials, so the content your product generates is traceable to real standards and real instructional materials rather than what the model recalls from training.
Powering diagnostic personalization. Pairing Knowledge Graph data with your own student or assessment data unlocks adaptive experiences that go deeper than content recommendations. Learning components and learning progressions give you the structure to surface prerequisite gaps and plan targeted interventions, so your product can move beyond recommending content and start targeting the specific skill gap behind a student’s struggle.
Expanding into new states. Standards crosswalks tell you how closely academic standards in different states relate to one another, based on shared underlying learning components rather than text similarity. This lets you scope coverage gaps before committing engineering resources, so you know exactly what needs to be built before entering a new state rather than discovering gaps after you have already launched.
How to get started
Learning Commons Platform includes a Knowledge Graph Data Catalog, where you can browse available datasets by publisher and subject, download the open ones directly, and request access to gated ones, before writing any code.
For engineers ready to make a first query, Quickstart walks through your first API call or file download with working examples. The Claude Connector is available for teams who want to explore the graph in plain language without any setup.